
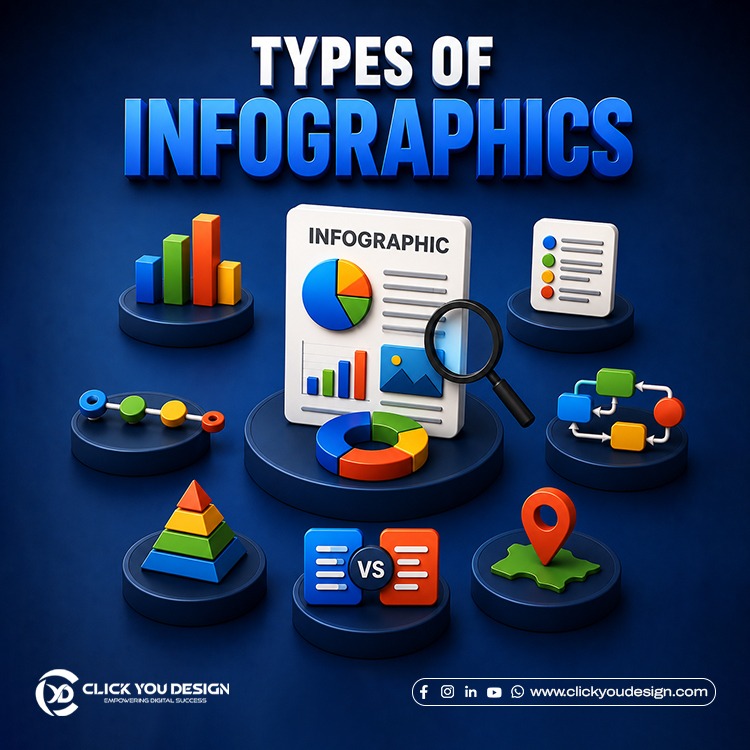
Types of Infographics provide a comprehensive understanding of the role of infographics in the marketing field. There are different types of infographics. However, in this blog, we discuss only five types of infographics and the benefits of using infographics in marketing.
Infographics help viewers understand a subject quickly, easily, and effortlessly. This type of visual illustration combines concise text with effective graphics to deliver clear and impactful visual communication.
Click You Design creates impactful infographics that you can integrate into your website to improve SEO performance, build brand awareness, and enhance social media marketing. Now, let’s explore the topic.
What are infographics?
An infographic is a blend of information and impactful visuals. It includes graphs, diagrams, charts, images, text, and icons. As a result, people find infographics an effective way to understand a topic clearly and easily instead of spending time reading lengthy scripts or blocks of text.
Therefore, infographics have become an inevitable part of websites. They engage visitors and encourage them to spend more time exploring content through visual communication. In addition, they reduce the bounce rate and make website content easier to read and understand.
Advantages of Infographics?
1. Enhance Understanding
Infographics present information in a structured format. They use charts, graphics, icons, and concise text to explain a subject clearly. As a result, people understand information quickly and with less effort.
2. Create Engagement
Plain text can make website visitors lose interest and leave quickly. However, visual elements capture attention and encourage visitors to stay longer. They spend more time exploring the visuals and reading the supporting text. Therefore, infographics play an important role in improving website engagement.
3. Easy Sharing
Infographics are highly shareable across different social media platforms. For example, Click You Design shares infographic posts on LinkedIn that anyone can repost. Consequently, this increases the reach of the shared information exponentially among online audiences.
4. SEO Boost
Infographics add value to your content strategy and strengthen your website’s SEO. They increase user engagement, attract more traffic, and generate more leads. As a result, businesses can build a stronger online presence and improve growth
5 types of infographics: a complete guide
There are plenty of infographic ideas. In this blog, let’s explore five types of infographics with examples.
1. Statistical Infographics: Emphasise Data
Statistical infographics focus on survey results and data-driven information. They present data through visually compelling charts, graphs, and graphics. As a result, they highlight numerical details clearly and make complex information easier to understand.
Statistical infographics are perfect for:
- Survey results
- Industry trends
- Showcasing data analysis
2. Informational Infographics: Educate Your Audience
Informational infographics educate your audience. They raise awareness by presenting information in a simple and effective way. Moreover, they break down complex topics into easy-to-understand visuals using icons, graphs, images, and supporting text. As a result, people can understand the message quickly and clearly.
Informational infographics are ideal for:
- Tutorials
- Guides
- Brand awareness
3. Timeline Infographics: Represent Progress
Presenting the history or progress of something with only words can feel tiring. As a result, people may skip those sections. Therefore, timeline infographics provide an effective solution by visualizing progress in a clear and engaging way.
They present dates, timelines, schedules, and key events in chronological order. Consequently, people can follow each stage and understand the progress step by step.
Timeline infographics are ideal for:
- Highlighting company success
- Showing the evolution of a company
- Any narrative with a timeline structure
4. Process Infographics: A Complete Guide
Process infographics visualize a working process through a flowchart-like structure. They often use layouts such as pyramids, hourglass diagrams, and other step-by-step visual formats. As a result, people can understand each stage of a process easily.
Process infographics are effective for:
- Highlighting marketing strategies
- Presenting blog writing steps
- Explaining the execution of a process
5. Comparison Infographics
Comparison infographics mainly represent the similarities and differences between two products, services, or ideas. They highlight key points through visuals. As a result, people can compare information easily and make better decisions.
Comparison infographics are perfect for:
- Comparing products
- Examining services
Conclusion
In this blog, we discussed five types of infographics. However, there are a few more types that we will cover in future blogs as a continuation of this topic.
At Click You Design, we create effective infographics that support business success. We believe infographics communicate the core idea of a business clearly and leave a lasting impression on the audience. Therefore, the importance of infographics is inevitable for any business.
Whether you are running a business or planning to start one, educating your audience about your products or services is essential. Moreover, infographics make that communication simple, engaging, and effective. If you are looking for high-quality infographics, contact us.